First agricultural census in almost 20 years shows growth in farm numbers and shift toward oilseeds
Kazakhstan's Bureau of National Statistics has released the results of the country's first National Agricultural Census in nearly 20 years.
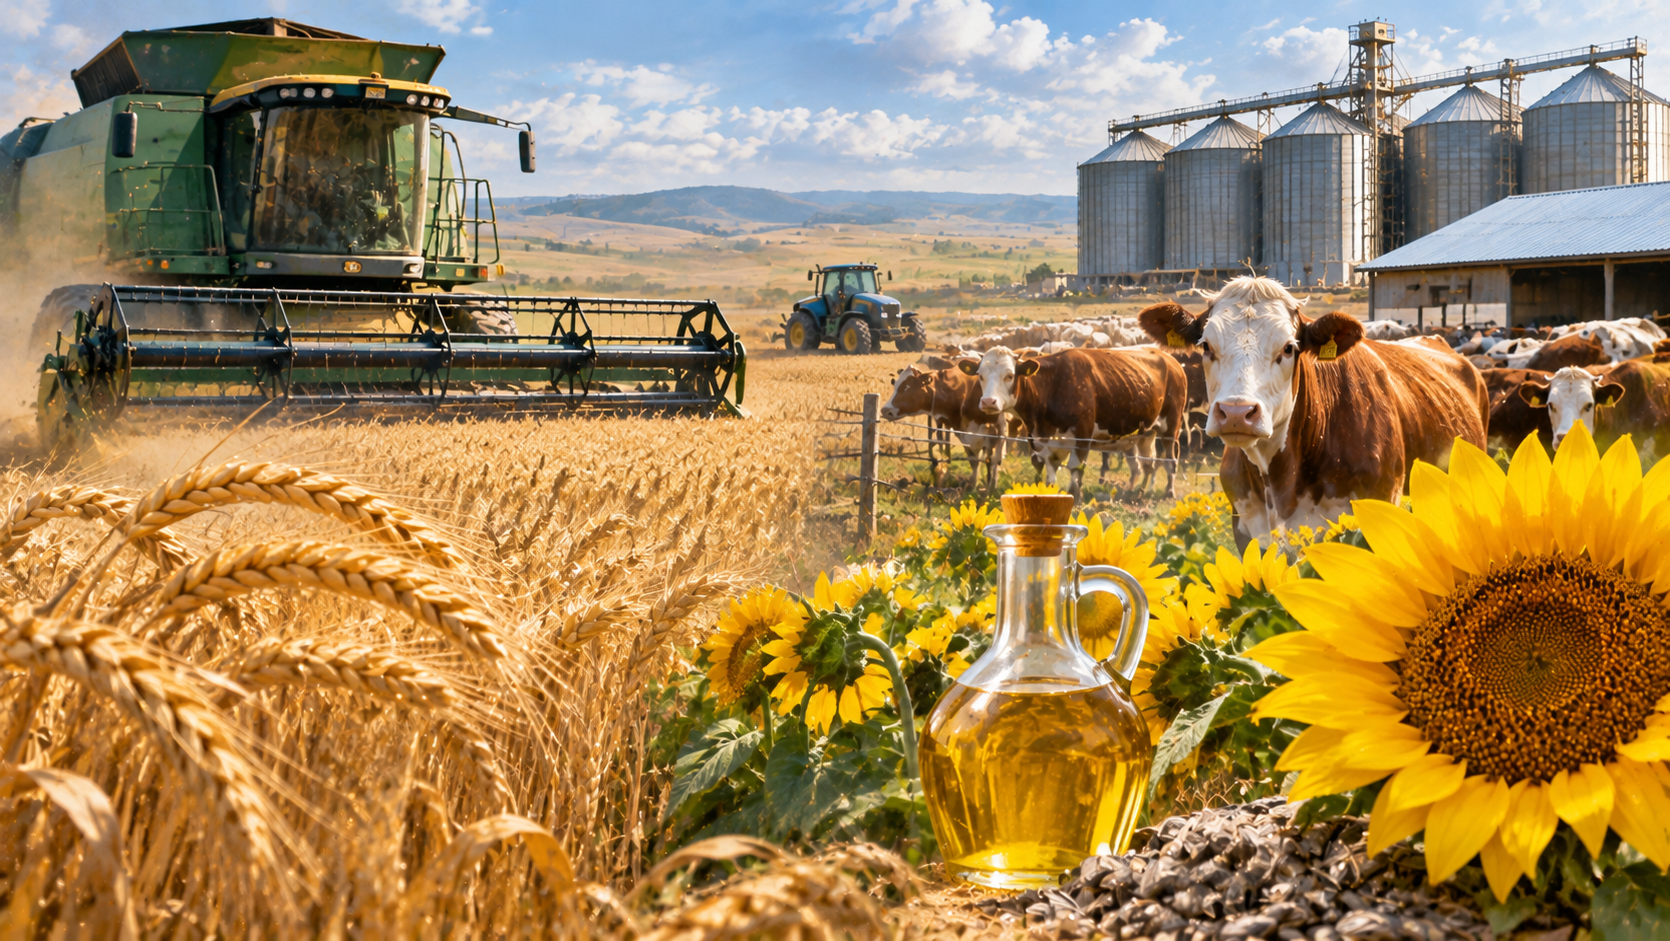
Between the censuses, the number of agricultural entities grew by 42%, the share of oilseeds in the crop structure increased, and most livestock became concentrated in the organized sector, reports the Bureau of National Statistics of the Agency for Strategic Planning and Reforms.
The essence in brief
- The number of agricultural entities reached 290 thousand versus 204 thousand according to the previous census, and agricultural enterprises more than doubled: 21 thousand versus 9.5 thousand.
- Sown area increased from 18.3 to 23.2 million hectares, the share of grains decreased from 81% to 69%, while the share of oilseeds grew from 4% to 17%.
- Agricultural entities account for 68% of livestock in conventional heads, while personal subsidiary farms account for 32%, whereas in the previous census entities had 20%.
- About 707 thousand people are employed in the organized sector, and 57% of self-propelled agricultural machinery has been in operation for more than 10 years.
How the census was conducted
The census ran from August 1 to October 20, 2025, with the support of the Food and Agriculture Organization of the United Nations (FAO). The previous one was conducted in 2006-2007. About 290 thousand agricultural entities and 1.7 million personal subsidiary farms (PSFs) were covered, with coverage of both reaching 97%.
Data were collected in digital format: 92% of agricultural entities and 19% of PSFs completed it online. When enumerators visited respondents, they filled out forms on tablets.
How many farms there are now
Over the intercensal period, the number of agricultural entities increased by 42%, from 204 thousand to 290 thousand. The number of agricultural enterprises more than doubled, from 9.5 thousand to 21 thousand. The number of peasant and farm enterprises (PFEs) and individual entrepreneurs (IEs) reached 269 thousand instead of 194 thousand.
What changed in the fields
Sown area increased from 18.3 million to 23.2 million hectares. At the same time, the ratio of crops changed: the share of grains in the crop structure decreased from 81% to 69%, while the share of oilseeds grew from 4% to 17%.
Where livestock is now concentrated
The distribution of livestock among categories of farms changed most significantly. Measured in conventional heads, that is, reducing different types of livestock to a single indicator, after the previous census agricultural entities accounted for 20% of livestock. In 2025, their share reached 68%, while personal subsidiary farms accounted for 32%.
Who works and with what machinery
About 707 thousand people are employed in the organized sector. Of the recorded self-propelled agricultural machinery, 57% has been in operation for more than 10 years.
What else is in the results
The results are posted on the census portal in the form of interactive widgets and dashboards, machine-readable tables, and a statistical compendium. They can be used to see how many farms operate in a region, what crops they grow, what livestock and machinery they have, and to compare territories and categories of farms. In addition to the main indicators, the Bureau published information on the use of agricultural technologies and digital solutions, on cooperation, and on access to financing and infrastructure.
Author's conclusion
The census shows that the agricultural sector has become noticeably more organized: there are more agricultural entities, and they hold two-thirds of livestock. But 32% of livestock remains in personal subsidiary farms, so livestock support measures, including improvement of livestock genetics, will work at full strength only if they reach them as well. The second conclusion concerns machinery: with sown area growing to 23.2 million hectares and 57% of self-propelled machines older than 10 years, fleet renewal becomes a question not only of costs but also of the volume of work that farms will be able to perform. Regional tables will show where these imbalances are most pronounced.
Comments ()