How the income of an average Kazakhstani has changed over the past 30 years — and why it is not a straight line of growth
Fresh infographic from Visual Capitalist shows how the global income map has shifted over 30 years. We analyzed Kazakhstan's trajectory.
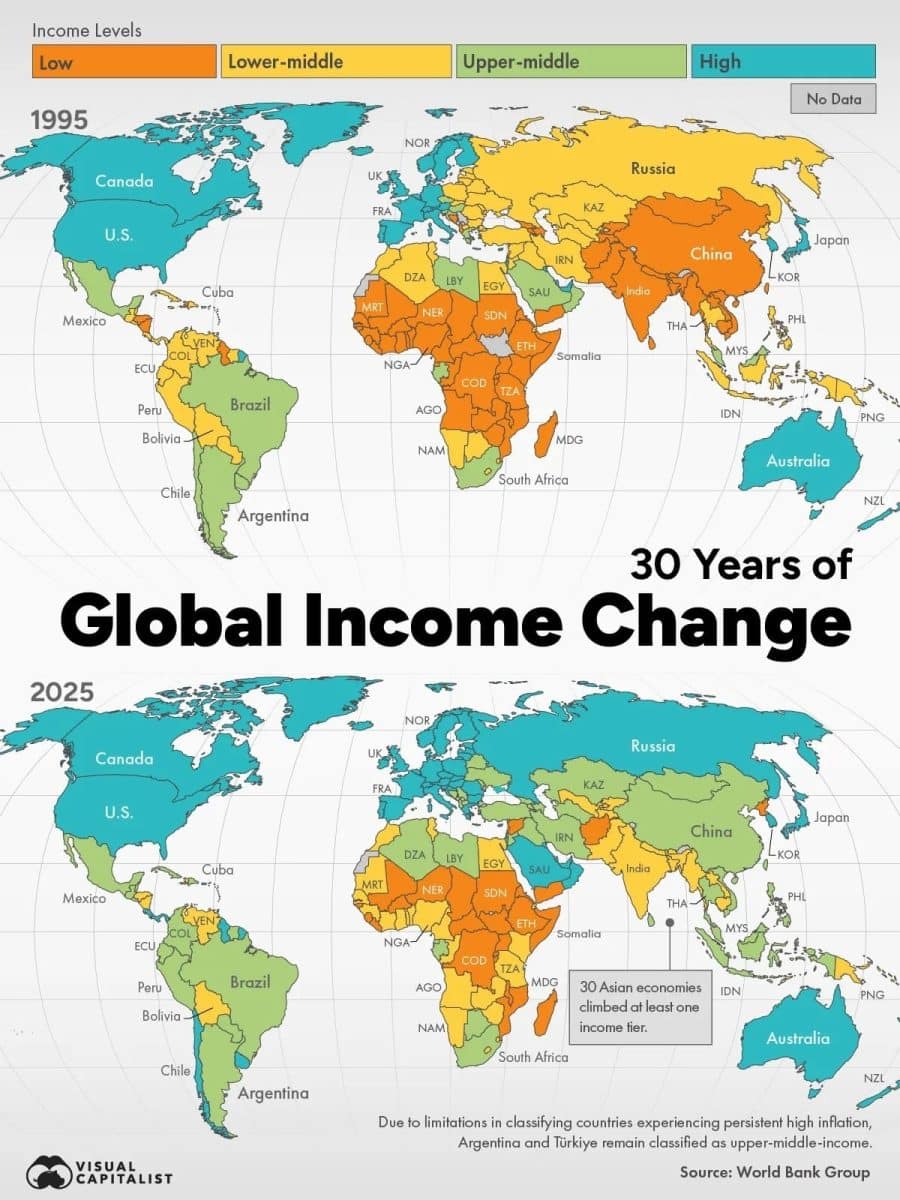
Eastern European countries have massively moved into the high-income category, thirty Asian economies have risen at least one step in the World Bank classification, and Guyana has made one of the sharpest leaps in history — from low income to high income thanks to oil. Kazakhstan has also come a long way over this thirty-year period, but not along a straight upward line, but through a collapse, a decade of stagnation, and only recent recovery.
The gist in brief
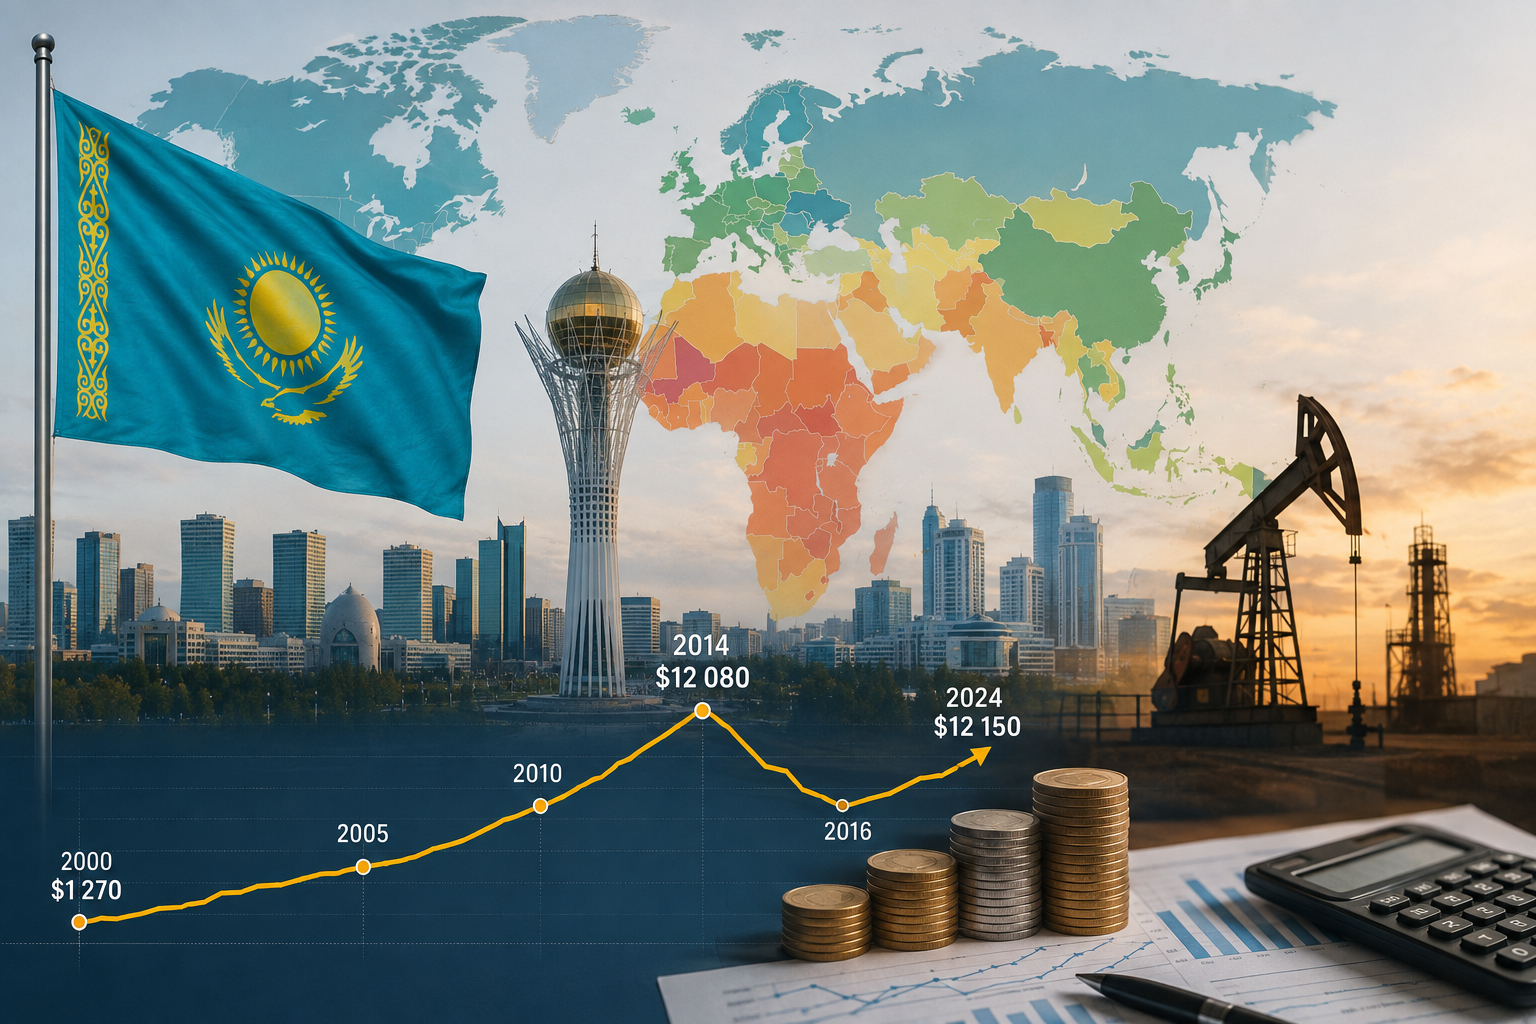
- According to the World Bank classification for 2025, the threshold for moving into the high-income group is $14,375 of gross national income (GNI) per capita using the Atlas method; Kazakhstan is in the upper-middle income group with a figure of $12,150 in 2024.
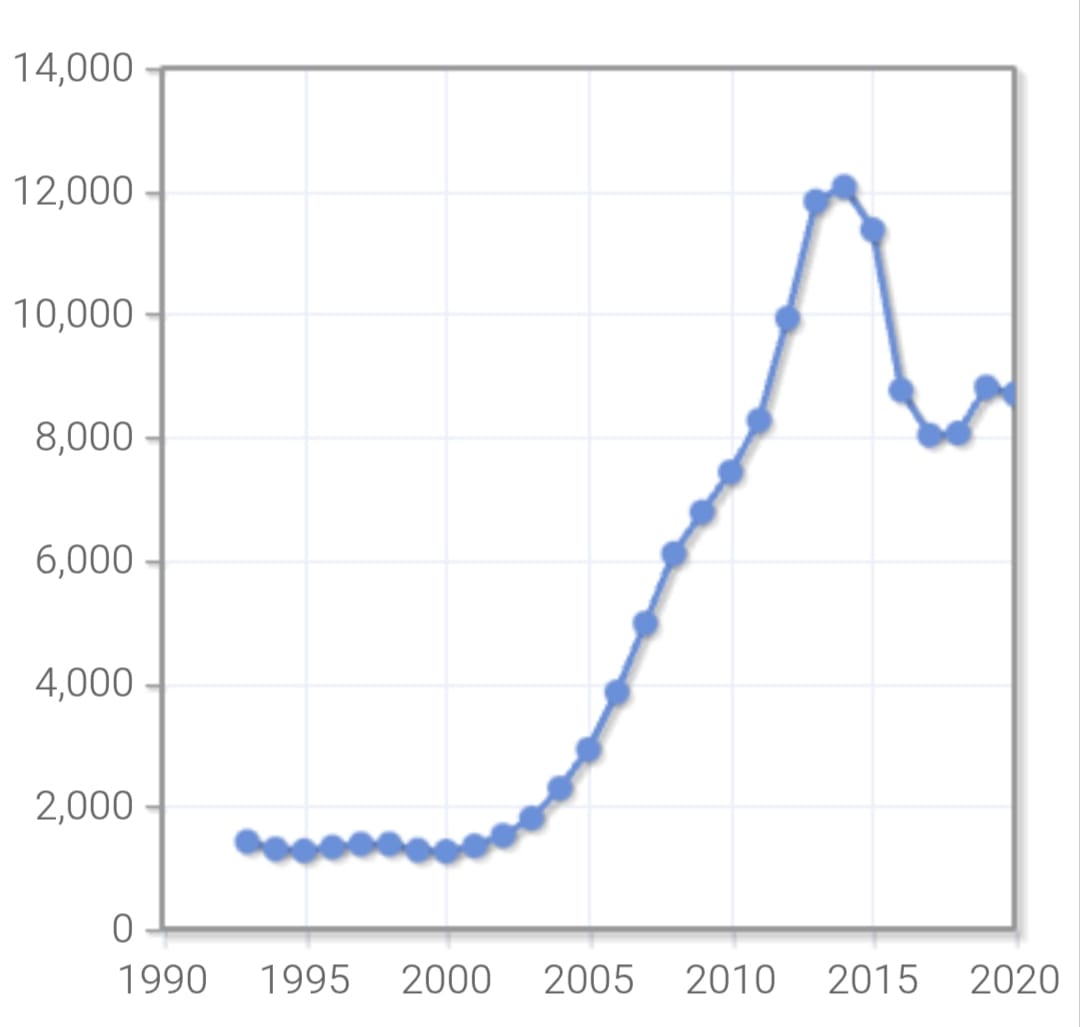
- Until recently, the peak for Kazakhstan remained 2014 — $12,080 amid high oil prices; only in 2024 did the country for the first time exceed this figure.
- In 2000, following the aftermath of the Russian financial crisis of 1998, Kazakhstan's GNI per capita fell to $1,270 — almost ten times lower than the current level.
- In the same Central Asia and EAEU region, the upper-middle income group also includes Belarus, Armenia, and Turkmenistan, while Uzbekistan, Kyrgyzstan, and Tajikistan remain in the lower-middle income category.
What the world map shows
Visual Capitalist infographics, built on World Bank data, compares the distribution of countries across four income categories in 1995 and 2025. The threshold values change every year: in 1995, the category boundaries were $725, $2,895, and $8,955, and by 2025 they had risen to $1,175, $4,635, and $14,375 — the growth reflects both inflation and the overall rise in the cost of the global economy over three decades. The most notable changes occurred in Eastern Europe, where market reforms, EU integration, and investment inflows moved a whole range of countries into the high-income category, and in Asia, where export-oriented growth and industrial development lifted thirty economies at least one step up.
Kazakhstan's path — not a straight line
The history of Kazakhstan's indicator is more interesting than a simple "getting richer year after year." After the collapse of the USSR and especially after the Russian financial crisis of 1998, which also hit the Kazakh economy, GNI per capita using the Atlas method fell to a minimum of $1,270 in 2000. Further growth, fueled by oil revenues of the 2000s and early 2010s, brought the indicator to a peak of $12,080 by 2014. But then came the tenge devaluation of 2015 and a sharp drop in global oil prices — the economy retreated several years back, and only by 2024 did Kazakhstan again exceed the level of a decade earlier, rising to $12,150. That is, the country's current status in the upper-middle income category is not the result of sustained linear growth, but the outcome of a full cycle: collapse, rise, new collapse, and renewed recovery.
Neighbors in the region
In the World Bank classification, Kazakhstan shares the upper-middle income category with Belarus, Armenia, and Turkmenistan — all four countries are in the range from $4,636 to $14,375. Uzbekistan, Kyrgyzstan, and Tajikistan remain in the lower-middle income category, which reflects an earlier stage of development and less dependence of their economies on commodity exports. The difference between neighboring countries in the region in this classification is telling: it reflects not only the current level of prosperity, but also different models of economic development over recent decades — from commodity exports to more diversified but so far less profitable economies.
Author's conclusion
The difference between Kazakhstan's indicator ($12,150) and the high-income threshold ($14,375) at first glance does not look huge — about 15%. But the history of the past thirty years shows that for the Kazakh economy, such a gap can either narrow over a few successful years or widen in a single crisis year — the dynamics of the indicator are much more closely tied to oil prices and the tenge exchange rate than to sustained structural growth. Moving into the high-income category is not a matter of one good year, but a question of whether the next growth cycle can be made more resilient to external shocks than the previous two.

Comments ()