Oasis-meter - a map of heat islands in Almaty
Urban microclimate monitoring project. An interactive 3D map shows which buildings are truly "hot" and where the air is breathable.
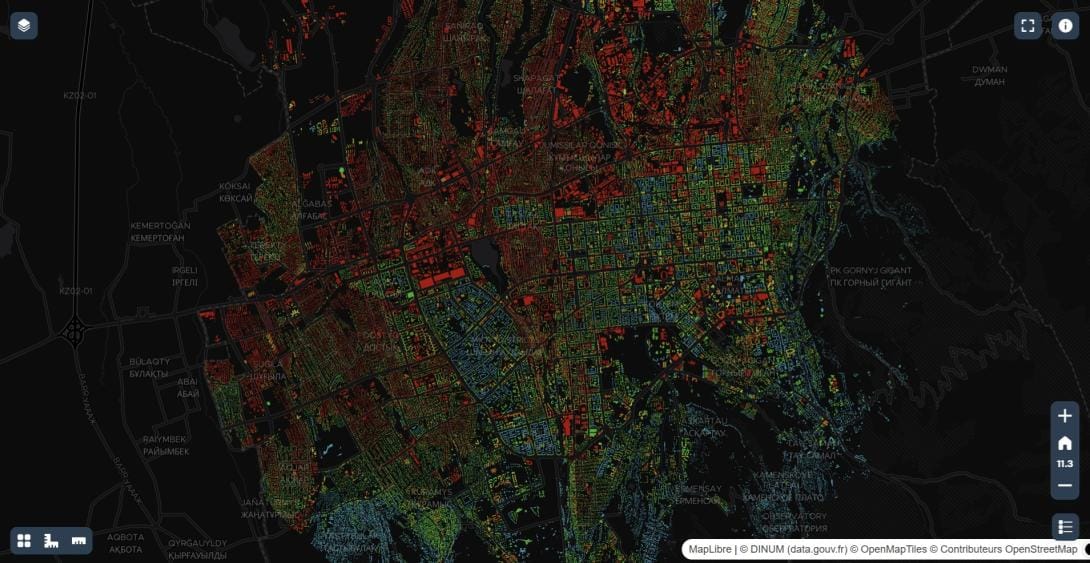
We have launched an important project together with the Geobox and Giscarta teams to monitor the urban microclimate. This is an interactive 3D map that shows which buildings are literally "burning" and where you can breathe.
How it works: We analyzed satellite data, the state of green cover, and building density. All of this was packaged into the "Oasis-meter" index, which assesses the comfort level of each object.
The gist in brief: Concrete and asphalt accumulate heat during the day and release it back in the evening. This creates the "heat island" effect — when buildings are superheated and act as thermal batteries. It has been proven that this negatively affects human health.
What's on the map: Buildings are divided into 5 categories: from "Inferno" (red) to "Oasis" (light blue). By clicking on any building, you can see its actual temperature and comfort score.
Why this is needed: This is a tool not only for city administrations and urban planners but also for every resident. Now you can independently monitor the ecological state of your district and understand how comfortable the environment around your home is. The map clearly shows where enhanced greening is needed.
The map is also available via the link: https://map.giscarta.com/viewer3d/3219f397-6aeb-40de-9960-9394a57f5f80
Special thanks to the teams at Geobox and Giscarta. True professionals: they extracted the most complex analytics and turned huge datasets into a clear and modern tool. Working with you on such a high-tech project is a pleasure.



Comments ()